
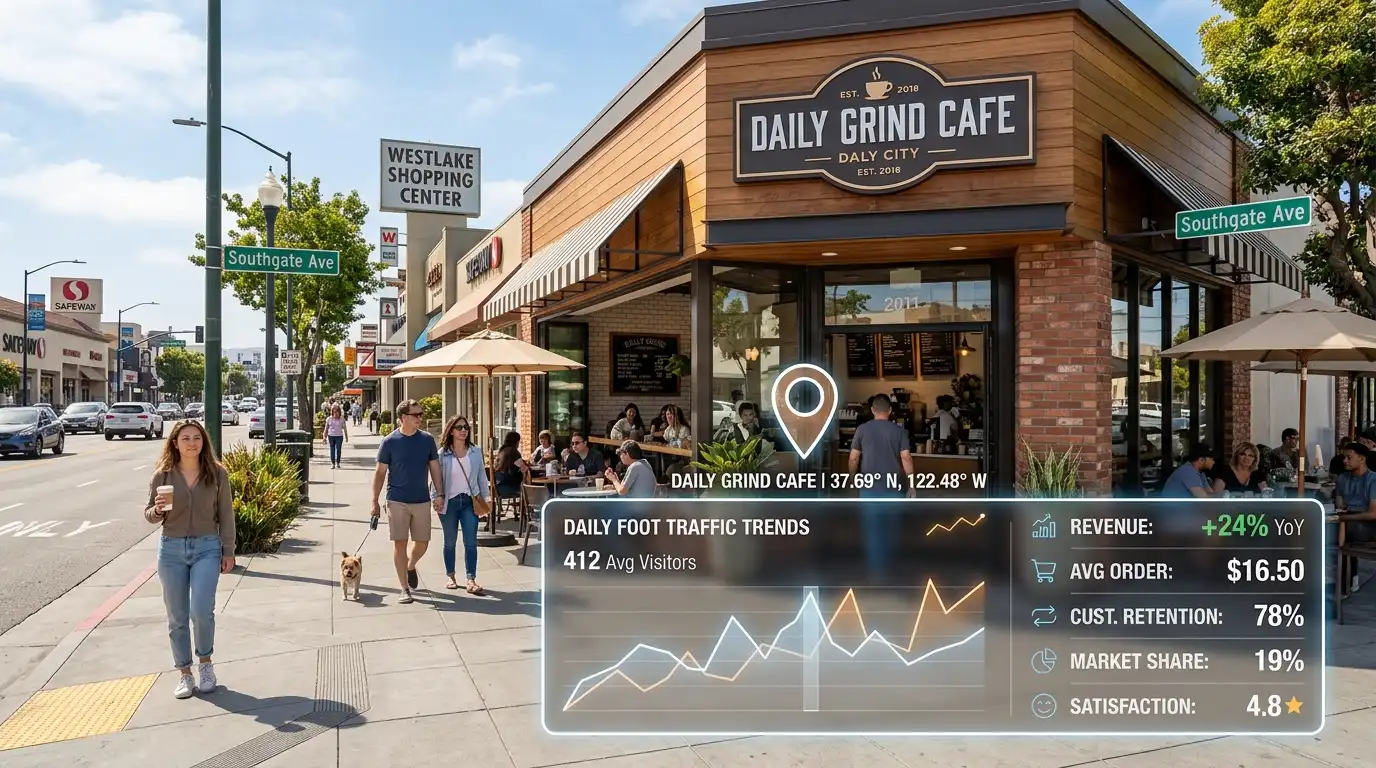
In today’s competitive retail climate, relying on gut feeling or foot traffic luck is no longer enough. To build sustained profitability, independent merchants must harness local analytics for small business growth. By converting raw data—such as search queries, map directions, point-of-sale patterns, and commute times—into actionable operational decisions, Daly City business owners can consistently attract new patrons and keep local regulars returning.
1. Demystifying Local Analytics: What Data Should You Actually Track?

When small business owners hear the word “analytics,” they often think of complex digital marketing dashboards or enterprise software. However, for a brick-and-mortar store in Daly City, local analytics simply means measuring how people find, evaluate, and interact with your physical establishment.
Instead of tracking web vanity metrics like page impressions, local merchants should focus on three foundational data buckets:
- Discovery Analytics: How customers discover your store online through local search terms, map searches, and review sites.
- Intent & Action Metrics: High-intent actions such as phone calls, requests for driving directions, or clicks to view your food or service menu.
- Transaction & Behavioral Data: In-store purchasing habits, peak visitor hours, average basket size, and repeat visit frequency recorded by your point-of-sale (POS) system.
According to economic data published by the U.S. Census Bureau Daly City QuickFacts, Daly City maintains a high population density of over 13,000 people per square mile alongside a median household income exceeding $120,000. This dense, high-purchasing-power environment means even minor optimization of your local traffic funnel can yield substantial revenue increases.
2. Capitalizing on High-Intent Search Data & Map Insights
The vast majority of physical visits begin with a digital search on a mobile phone. Whether a commuter emerging from the Daly City BART station is searching for “best boba near me” or a neighborhood resident looks for “groceries near Mission Street,” high-intent search behavior signals immediate purchasing interest.
Optimizing Google Business Profile Insights
Your Google Business Profile (GBP) dashboard acts as a free, highly accurate local foot-traffic analytics center. Official setup guidance available through Google Business Profile Help highlights several key metrics every merchant should monitor weekly:
- Local Search Queries: Analyze the exact keywords searchers type before landing on your listing. If data shows high volume for “dog-friendly patio cafe Daly City,” highlighting patio seating on your profile can immediately boost conversions.
- Directions Requests Origin: See which geographic zip codes or neighborhoods (e.g., Broadmoor, St. Francis, or Outer Mission) generate the most requests for turn-by-turn driving directions.
- Peak Search Windows: Align your staffing and daily special announcements with the exact hours and days your listing receives maximum search activity.
3. Unlocking Hidden Growth in Your Point-of-Sale (POS) Data
While search insights show how customers find your store, your POS system (such as Square, Clover, or Toast) reveals what happens once they walk through your doors. Modern cloud POS systems generate rich behavioral reports that help small businesses optimize inventory, labor costs, and customer retention programs.
| Analytics Dimension | Data Point Tracked | Actionable Retail Strategy |
|---|---|---|
| Hourly Transaction Volume | Sales spikes during morning/evening commute hours | Adjust employee shift scheduling and introduce quick-serve grab-and-go combos. |
| Item Attachment Rate | Percentage of coffee orders that include a pastry | Train staff to cross-sell low-cost, high-margin add-ons at the register. |
| Customer Retention Rate | Frequency of card swipes or loyalty scans by unique ID | Launch automated SMS rewards when a regular customer hasn’t visited in 30 days. |
Businesses operating in competitive peninsula retail corridors can also gain broader market perspective through Daly City Daily, exploring localized neighborhood guides, community highlights, and regional business updates to stay aligned with neighborhood trends.
4. Turning Commuters into Repeat Customers: Local Loyalty Analytics
Daly City serves as a major transit hub connecting San Mateo County with San Francisco. Thousands of daily commuters pass through local transit corridors. Acquiring a new customer costs significantly more than retaining an existing one, making repeat retention your most profitable growth lever.
Data-Driven Strategies for Higher Retention:

- Digitize Your Loyalty Program: Replace paper punch cards with phone-number or card-linked loyalty tracking. This allows you to collect customer visit frequency data effortlessly.
- Segment Your Customer Base: Use POS analytics to group customers into categories—such as “Daily Commuters,” “Weekend Families,” or “Lapsed Regulars”—and tailor promotions specifically to their buying habits.
- Optimize Opening Hours for Commuter Flows: If analytics reveal strong map direction requests between 6:30 AM and 8:00 AM, opening 30 minutes earlier could capture valuable morning sales before competitors open.
5. A 30-Day Action Plan for Daly City Business Owners
Implementing local analytics does not require a dedicated IT department or massive budget. Small business owners can start seeing measurable results by following this simple four-step implementation process:
Week 1: Verify and Audit Your Digital Profiles
Claim and verify your Google Business Profile, Apple Maps, and Yelp listings. Ensure your business name, address, phone number (NAP), and opening hours match perfectly across all platforms.
Week 2: Benchmark Your Baseline Metrics
Log into your GBP and POS dashboards. Record baseline numbers for monthly directions requests, phone calls, average basket value, and peak transaction hours.
Week 3: Launch One Targeted Experiment
Based on your search query data, introduce a micro-campaign (e.g., a commute-hour discount or a targeted local service package) and track redemption through dedicated POS promo codes.
Week 4: Measure Impact and Refine
Compare post-experiment transaction volume and foot traffic against your baseline. Double down on what worked and refine unoptimized offers.
Conclusion: Competing Smarter in Daly City’s Evolving Market
In a dynamic market like Daly City, small business success is built on understanding the unique habits of local residents and neighborhood commuters. By taking advantage of free digital map insights, analyzing point-of-sale transaction data, and tailoring storefront operations to real customer behavior, independent shop owners can consistently convert local pedestrian and commuter traffic into lasting business growth.